Quick Chart Example: Line Chart
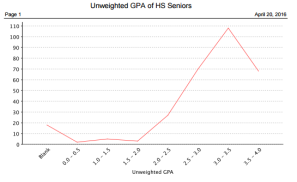
Crow Point High School principal Michael Rogers wants a line chart for a visual representation of the unweighted GPA of seniors.
To create the line chart:
- Michael logs on to the School view and clicks the Student tab.
- He queries for YOG
 year of graduation=2022.
 - He then clicks
 and selects Create Quick
Chart to bring up the Quick Chart wizard.
and selects Create Quick
Chart to bring up the Quick Chart wizard. - In Step 1 of the Quick Chart wizard, Michael selects New report and clicks Next.
- In Step 2 of the wizard, Michael selects Quick Chart - Line for Report Type and Standard Line Chart for Format and clicks Next.
- In Step 3, Michael
specifies the data he wants displayed in his chart. He clicks
 in
the Categories (Horizontal
Axis) section to the right of the Group
by field to open a pick list pop-up, and chooses Student
for the Table, and Unweighted GPA for the Group by field.
He then clicks OK to save his selections and return to the
Field Selection step of the wizard. Because Unweighted GPA is a numeric field, he must specify the
Interval for the categories on the horizontal axis. Michael
selects Interval group
for the Interval and specifies 0.5
for the Interval group size.
The categories on the horizontal axis will be cumulative GPAs of 0.0-0.5,
0.5-1.0, 1.0-1.5 and so on. The first category contains cumulative
GPAs from 0.0 up to but not including 0.5.
in
the Categories (Horizontal
Axis) section to the right of the Group
by field to open a pick list pop-up, and chooses Student
for the Table, and Unweighted GPA for the Group by field.
He then clicks OK to save his selections and return to the
Field Selection step of the wizard. Because Unweighted GPA is a numeric field, he must specify the
Interval for the categories on the horizontal axis. Michael
selects Interval group
for the Interval and specifies 0.5
for the Interval group size.
The categories on the horizontal axis will be cumulative GPAs of 0.0-0.5,
0.5-1.0, 1.0-1.5 and so on. The first category contains cumulative
GPAs from 0.0 up to but not including 0.5. - In Step 4, Michael enters Unweighted GPA of HS Seniors in the Report title field. Michael uses the default settings for the remaining Header options. For the Chart summary, Michael accepts the default for Data Set Totals (selected by default) and clicks Next.
- In Step 5 of the Quick Chart Wizard, Michael uses the default values and clicks Finish.
The resulting line chart appears: